The Short Answer: Green means good, maroon means hazardous, but what do the AQI numbers between them mean for your health? A complete guide to understanding and acting on air quality…
You’ve seen the numbers, “AQI 85” on your weather app, “AQI 157” during wildfire season. But what do they actually mean for whether you should open your windows, go for a run, or turn on your air purifier? Most people glance at the color, assume “yellow is probably fine,” and move on. That casual approach can cost you, especially if you or someone in your household has asthma, allergies, or a heart condition.
This guide breaks down every AQI level in detail, explains the difference between AQI, PM2.5, and PM10, and gives you concrete action steps for each scenario. Whether you’re deciding whether to air out your house or choosing the right air purifier for allergies and asthma, understanding AQI is the foundation of good indoor air quality management.
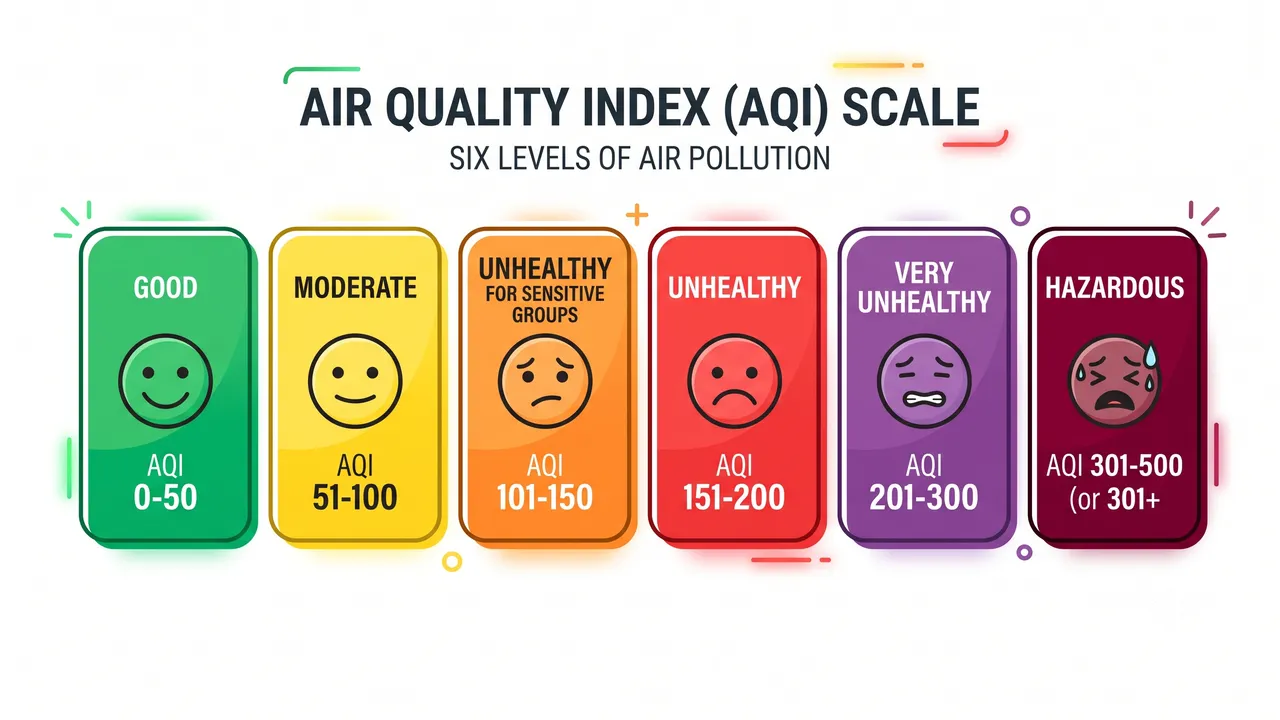
AQI Levels Explained: The Complete Breakdown
The EPA’s Air Quality Index translates raw pollutant concentrations into a 0–500 scale with six color-coded health concern categories. Here’s the full picture:
| AQI Range | Color | Health Concern Level | Health Implications | Recommended Actions |
|---|---|---|---|---|
| 0–50 | 🟢 Green | Good | Air quality is satisfactory. Little to no risk from air pollution. | Enjoy outdoor activities freely. Open windows for ventilation. No purifier needed for pollution control. |
| 51–100 | 🟡 Yellow | Moderate | Acceptable air quality. Unusually sensitive individuals may experience mild symptoms, slight throat irritation, minor eye discomfort, or mild coughing. | Most people can continue normal activities. Sensitive individuals should reduce prolonged outdoor exertion. Start running purifiers on low/auto if you have respiratory conditions. |
| 101–150 | 🟠 Orange | Unhealthy for Sensitive Groups | Members of sensitive groups (asthma, COPD, heart disease, children, elderly 65+) may experience worsened symptoms. General public is less likely to be affected but may notice mild irritation at the upper end (130+). | Sensitive groups: limit prolonged outdoor exertion. Close windows and run air purifiers on auto. Everyone should monitor symptoms. |
| 151–200 | 🔴 Red | Unhealthy | Everyone begins to experience health effects. Sensitive groups may experience more serious effects, asthma attacks, increased heart rate, difficulty breathing. Even healthy adults may feel throat irritation and fatigue. | Avoid outdoor exertion for everyone. Close all windows and run purifiers on medium-high. Wear N95 masks if outdoor exposure is unavoidable. |
| 201–300 | 🟣 Purple | Very Unhealthy | Health alert: the entire population is at risk. Significant increases in respiratory and cardiovascular effects. Emergency room visits rise measurably at this level. | Avoid all outdoor activity. Seal windows (tape gaps if necessary). Run purifiers on maximum. Wear N95 masks outdoors. Consider relocating temporarily if levels persist for days. |
| 301–500 | 🟤 Maroon | Hazardous | Health emergency. Serious respiratory and cardiovascular effects for everyone. Prolonged exposure can cause lasting lung damage. Vulnerable populations face life-threatening risk. | Stay indoors at all costs. Seal the home. Run all available purifiers on max. Use HEPA masks (N95 minimum) if you must leave. This level is rare outside of severe wildfire events or industrial disasters. |
Understanding the Thresholds
The boundaries between categories aren’t as clean as the colors suggest. AQI 50 and AQI 51 are nearly identical in actual pollutant concentration, yet one is “Good” and the other is “Moderate.” What matters more is the trend:
- Rising AQI from 45 to 70: Conditions are deteriorating. Sensitive individuals should start paying attention.
- Steady AQI at 90: Technically “Moderate,” but if you have asthma or COPD, treat this as if it were “Unhealthy for Sensitive Groups.”
- AQI above 100 for extended periods: Even if you feel fine, cumulative exposure over days or weeks carries health risks. Long-term exposure to elevated PM2.5 is linked to reduced lung function, cardiovascular disease, and cognitive decline.
The “sensitive groups” referenced in the orange category are broader than most people think. They include anyone with asthma, COPD, or other chronic lung diseases; people with heart disease or arrhythmias; children under 14 whose lungs are still developing; adults over 65; pregnant women; and people who exercise or work outdoors for extended periods.
What Goes Into AQI
The AQI is calculated from five criteria pollutants tracked by the EPA:
- Ground-level ozone (O₃), Formed when sunlight reacts with vehicle emissions and industrial pollutants. Dominates on hot, sunny summer afternoons. Not the same as the protective ozone layer in the stratosphere.
- Particulate matter (PM2.5), Microscopic particles smaller than 2.5 micrometers. Generated by combustion (vehicles, wildfires, power plants, cooking). Penetrates deep into the lungs and enters the bloodstream. Usually the dominant pollutant during wildfire events and in urban areas with heavy traffic.
- Particulate matter (PM10), Particles smaller than 10 micrometers. Includes dust, pollen, mold spores, and construction debris. Coarser than PM2.5 but still respirable.
- Carbon monoxide (CO), Colorless, odorless gas from incomplete combustion. Elevated near heavy traffic or during temperature inversions that trap pollutants near ground level.
- Sulfur dioxide (SO₂), Primarily from industrial processes, especially coal-burning power plants. Can trigger bronchospasm in asthmatics at surprisingly low concentrations.
- Nitrogen dioxide (NO₂), Produced by vehicle engines and power plants. Contributes to smog formation and increases susceptibility to respiratory infections.
The overall AQI reported is the highest individual pollutant sub-index, not an average. If ozone is 120 (orange) but PM2.5 is 80 (moderate), the reported AQI is 120. This is a critical detail: the AQI can be “good” overall while one specific pollutant is elevated. If you’re sensitive to ozone specifically, check the pollutant breakdown on AirNow or IQAir rather than relying on the headline number alone.
AQI vs PM2.5 vs PM10: What’s the Difference?
These terms are related but describe different things, and confusing them can lead to poor decisions:
AQI (Air Quality Index) is a normalized score that converts pollutant concentrations into a 0–500 scale. It’s designed to be human-readable, a single number that communicates health risk regardless of which pollutant is responsible. AQI uses different concentration breakpoints for each pollutant, so an AQI of 100 means different things depending on whether it’s driven by ozone or PM2.5.
PM2.5 (Fine Particulate Matter) is a specific measurement of particles with a diameter of 2.5 micrometers or less, about 30 times smaller than a human hair. It’s measured in micrograms per cubic meter (µg/m³). A PM2.5 concentration of 12.0 µg/m³ or below corresponds to “Good” AQI (0–50). PM2.5 is the pollutant of greatest concern for most people because these particles penetrate deep into lung tissue, enter the bloodstream, and can affect every organ in the body. Sources include vehicle exhaust, wildfire smoke, cooking fumes, tobacco smoke, and industrial emissions. For a deeper look, see our HEPA filter deep-dive guide.
PM10 (Coarse Particulate Matter) measures particles up to 10 micrometers, roughly the width of a fine human hair. These larger particles are trapped more easily in the upper airways (nose, throat, bronchi) but can still reach the lungs. Common sources include road dust, construction sites, agricultural activity, pollen, and mold spores. PM10 is generally less dangerous per microgram than PM2.5, but high concentrations still trigger respiratory symptoms, especially in people with asthma.
Key Differences at a Glance
| AQI | PM2.5 | PM10 | |
|---|---|---|---|
| What it is | Normalized health index (0–500) | Mass concentration (µg/m³) of particles <2.5µm | Mass concentration (µg/m³) of particles <10µm |
| What it measures | Overall air quality health risk | Fine particle pollution | Coarse particle pollution |
| Penetration | N/A | Deep into lungs, enters bloodstream | Upper airways and lungs |
| Primary sources | Composite of 5 pollutants | Combustion, smoke, vehicles | Dust, pollen, construction |
| ”Good” threshold | 0–50 | 0–12.0 µg/m³ | 0–54 µg/m³ |
| Dangerous threshold | 151+ | 55.5+ µg/m³ | 255+ µg/m³ |
For most people monitoring air quality at home, PM2.5 is the number to watch. It’s the pollutant most commonly responsible for elevated AQI, especially in urban environments and during wildfire season.
How to Check AQI in Your Area
You have more options than ever for real-time air quality data. Here are the most reliable sources:
Apps
- AirNow (Free), The EPA’s official air quality app. Provides real-time AQI, pollutant-specific breakdowns, and fire and smoke maps. The best source for U.S. data. Available on iOS and Android.
- IQAir AirVisual (Free), Global coverage with a clean interface. Offers 7-day AQI forecasts, health recommendations, and real-time PM2.5 data from a network of over 10,000 monitoring stations worldwide. Best for international travelers or monitoring multiple locations. Available on iOS and Android.
- Plume Labs Air Report (Free), Provides hourly and next-day air quality forecasts with personalized activity recommendations. Clean design, easy to read at a glance.
- BreezoMeter (Free, premium tier), Street-level air quality resolution using AI modeling between monitoring stations. Useful if the nearest official monitor is far from your home.
Websites
- AirNow.gov, The definitive U.S. source. Features the Fire and Smoke Map, which overlays real-time fire locations with air quality readings, essential during wildfire season.
- IQAir.com, Best global coverage. Useful for checking air quality at destinations before you travel.
- PurpleAir.com, Network of low-cost sensors that provides hyperlocal readings. Especially valuable in rural areas far from official monitors. Note: PurpleAir readings tend to run 10–30% higher than EPA monitors, so apply a correction factor.
- Apple Weather / Google Weather, Built-in AQI data in most weather apps. Convenient but provides less detail than dedicated air quality sources. Good for a quick glance, not ideal for detailed planning.
Pro Tip
Set up AQI alerts on your phone. AirNow and IQAir both let you set thresholds, for example, notify you when AQI exceeds 100 (orange). This way, you don’t have to remember to check manually. If you have asthma or another respiratory condition, set your alert at 51 (yellow) so you’re never caught off guard.
When to Close Windows Based on AQI
This is one of the most practical applications of AQI data, and it’s where most people get it wrong. The common assumption is that “moderate” air quality is fine for ventilation, but the answer depends on who’s in the house and what you’re doing.
The Simple Rule
| AQI | Windows | Purifier | Notes |
|---|---|---|---|
| 0–50 | ✅ Open freely | Off (unless indoor sources) | Best time to air out your home. Exchange stale indoor air with fresh outdoor air. |
| 51–75 | ✅ Open (morning/evening) | Low/Auto | Ventilate during cooler hours when ozone is lower. Close during peak afternoon heat. |
| 76–100 | ⚠️ Brief ventilation only | Auto/Medium | Open windows for 10–15 minutes to flush stale air, then close. Sensitive individuals should keep windows shut. |
| 101–150 | ❌ Keep closed | Medium-High | Outdoor air is now worse than typical indoor air. Sealing the home and filtering is the better strategy. |
| 151+ | ❌ Sealed tight | High | Check for drafts and seal gaps. If you must ventilate briefly (cooking odors, humidity), do it fast and close up immediately. |
| 200+ | ❌ Sealed, tape if needed | Maximum | Wildfire smoke or heavy pollution event. Consider temporary relocation if levels persist 48+ hours. |
Why Timing Matters
Outdoor AQI fluctuates throughout the day. Ozone peaks in the afternoon (1–4 PM) on hot, sunny days. PM2.5 from traffic peaks during rush hours (7–9 AM, 5–7 PM). During wildfire season, PM2.5 can remain elevated 24/7 but often worsens overnight as smoke settles into valleys.
If outdoor AQI is 80 (yellow) and dropping, you might wait an hour and open windows once it hits 60. If it’s 80 and climbing, close up now. The trend matters as much as the current reading. For more on this, see our guide on air purifier vs opening windows for ventilation.
Indoor-Specific Considerations
Even when outdoor AQI is good, there are times to keep windows closed and run a purifier:
- Cooking with gas stoves, Gas burners produce NO₂ and PM2.5. Ventilate with a range hood, not open windows, to control the direction of airflow. See our kitchen air quality guide.
- Cleaning or painting, VOCs from cleaning products and paint can spike indoor AQI well above outdoor levels. Ventilate with fans, not passive window-opening.
- High outdoor pollen counts, AQI doesn’t directly measure pollen, but on high-pollen days, opening windows floods your home with allergens. Use the purifier instead.
Indoor vs Outdoor AQI: Why They Differ
A common misconception is that indoor air quality simply mirrors outdoor air quality. In reality, indoor AQI can be dramatically better or worse than what’s happening outside, depending on your behavior and environment.
Indoor Air Can Be Worse
EPA studies consistently find that indoor pollutant levels can be 2 to 5 times higher than outdoor levels. Sources include:
- Cooking, Gas stoves produce NO₂, CO, and PM2.5. Frying and searing generate fine particles that can push indoor AQI into the orange or red range within minutes, even when outdoor air is pristine.
- Cleaning products, Aerosol sprays, bleach, and ammonia-based cleaners release VOCs and irritant gases.
- Building materials, New furniture, flooring, and paint off-gas formaldehyde and other VOCs for months after installation.
- Dust and dander, Pet dander, dust mites, and skin flakes circulate continuously. These contribute to PM10 and can trigger allergic reactions.
- Mold, Humidity above 60% promotes mold growth, which releases spores (PM10) and mycotoxins.
Indoor Air Can Be Better
When outdoor AQI spikes, during wildfires, heavy traffic periods, or industrial events, a well-sealed home with a quality air purifier can maintain indoor AQI in the green zone while outdoor air is deep orange or red. This is exactly what HEPA purifiers are designed for. For guidance on choosing the right one, see our best air purifiers 2026 guide or specific recommendations for wildfire smoke.
How to Monitor Indoor AQI
Don’t guess, measure. A dedicated air quality monitor gives you real-time indoor AQI readings so you can make data-driven decisions about ventilation and purifier settings. We recommend the best air quality monitors of 2026 for a detailed comparison, but key features to look for include:
- PM2.5 sensor, The single most important measurement. Look for laser-scattering sensors (more accurate than electrochemical).
- CO₂ monitoring, High CO₂ (above 1000 ppm) causes drowsiness and poor concentration. This tells you when you need to ventilate, regardless of AQI.
- VOC detection, Important for monitoring off-gassing from furniture, paint, and cleaning products.
- Historical data, The ability to see trends over hours and days helps you identify patterns (e.g., indoor AQI always spikes at 6 PM when you start cooking).
Indoor Decision-Making Guide
Use outdoor AQI to make indoor air decisions:
- AQI 0–50: Open windows for ventilation. No need to run purifiers unless you have indoor sources (cooking, cleaning). This is the best time to air out your home thoroughly.
- AQI 51–100: Ventilation is still fine for most, but sensitive individuals should run purifiers on auto. Limit window-open time during peak ozone hours (afternoon). Check the pollutant breakdown, if PM2.5 is the driver, a brief window-open session is fine; if ozone is high, keep the house sealed.
- AQI 101–150: Close windows, run purifiers on auto or medium. Sensitive groups should minimize outdoor time and wear N95 masks outside. Monitor indoor AQI with a dedicated air quality monitor to ensure your purifier is keeping up.
- AQI 151–200: Seal windows, run purifiers on medium-high. Avoid all outdoor exertion. If you have a whole-house system, boost the fan speed. For portable purifiers, make sure they’re properly sized for the room.
- AQI 200+: Purifiers on high continuously. Seal any gaps around windows and doors. If you must go outside, wear an N95 or P100 mask. Consider running purifiers in bedrooms overnight to protect sleep quality. Having a properly-sized purifier in every occupied room transitions from helpful to genuinely protective at this level.
Frequently Asked Questions
Is AQI the same everywhere in my city?
No. AQI can vary significantly across a single metropolitan area, sometimes by 50+ points between neighborhoods. Industrial zones, highways, and construction areas generate localized pollution that nearby monitors detect but distant monitors miss. If you live near a highway or industrial area, check the PurpleAir map for hyperlocal readings rather than relying on the citywide average.
How often does AQI update?
Official EPA monitors typically update hourly. PurpleAir sensors update every 10 minutes. IQAir updates in real-time where data is available. During rapidly changing conditions (wildfires, dust storms), more frequent updates matter, IQAir or PurpleAir will give you a more current picture than AirNow during fast-moving events.
Does AQI measure pollen?
No. The AQI tracks five criteria pollutants: ozone, PM2.5, PM10, carbon monoxide, sulfur dioxide, and nitrogen dioxide. Pollen is not included. If you have seasonal allergies, check pollen counts separately (Weather.com and the Zyrtec AllergyCast app both track pollen) in addition to AQI. On days with both high pollen and moderate AQI, keep windows closed and rely on a purifier with a HEPA filter.
Can indoor plants improve AQI?
The short answer is: not meaningfully. A famous 1989 NASA study showed plants removing VOCs in sealed chambers, but follow-up research found that you would need 10–1,000 plants per square meter to match the air-cleaning capacity of even a basic purifier in a normal room. Plants are wonderful for mental health and aesthetics, but don’t rely on them for air quality. Use a proper HEPA air purifier for filtration and a monitor to verify results.
Is “Moderate” AQI (51–100) actually safe?
It depends on your definition of “safe.” For healthy adults, moderate AQI poses minimal short-term risk. But “moderate” is not the same as “clean”, at AQI 99, you’re breathing roughly double the particulate matter of AQI 30. Research shows that long-term exposure to even moderately elevated PM2.5 (annual average above 10 µg/m³) is associated with increased cardiovascular mortality. If you have any respiratory or cardiac condition, treat moderate AQI as a signal to reduce outdoor exertion and consider running a purifier indoors.
Final Thoughts
Understanding AQI transforms air quality from a vague concern into an actionable daily habit. Check it each morning the same way you check the weather. Close windows when it climbs above 100. Run purifiers when it rises above 50 if you’re sensitive. And invest in a good indoor air quality monitor so you’re not guessing about what’s happening inside your home.
The numbers don’t need to be scary, they just need to be understood.
See also: Air Purifier vs Opening Windows for Ventilation · Wildfire Smoke Air Purifier Guide · Best Air Quality Monitors 2026 · How to Choose an Air Purifier: CADR and ACH Guide · HEPA Filter Deep-Dive Guide · Best Air Purifiers for Allergies and Asthma · Room-by-Room Air Purifier Guide · Kitchen Air Quality: Gas Stove and Range Hood Guide
Disclosure: This article contains affiliate links. If you purchase products through our links to Amazon, we may earn a small commission at no extra cost to you. We only recommend products we have personally tested or thoroughly researched. See our full affiliate disclosure for details.
You May Also Like
- Kitchen Air Quality: Why Your Gas Stove Is Polluting Your Home (and What to Do About It)
- How to Improve Indoor Air Quality Without an Air Purifier: 10 Science-Backed Methods
- Seasonal Indoor Air Quality Guide: Spring Allergies, Summer Humidity, Fall Wildfires, Winter Dry Air
- MERV Ratings Explained: Which HVAC Filter Should You Use for Better Indoor Air?
Related Articles
Air Purifier for COVID: What the Research Actually Says
Do HEPA air purifiers really protect against COVID? We review EPA guidance, 2025 research studies, and what actually works for virus protection.
New Nursery Furniture Smells? What You Need to Know About VOCs
New nursery furniture off-gasses VOCs and formaldehyde. What the research says about protecting your baby, and what actually helps.
Best Air Purifiers for New Homes 2026: Remove Formaldehyde and VOCs After Renovation
Just moved into a new home or finished renovation? Formaldehyde and VOCs from new furniture, paint, and flooring can cause headaches and respiratory issues. Here are the best air purifiers to remove them.
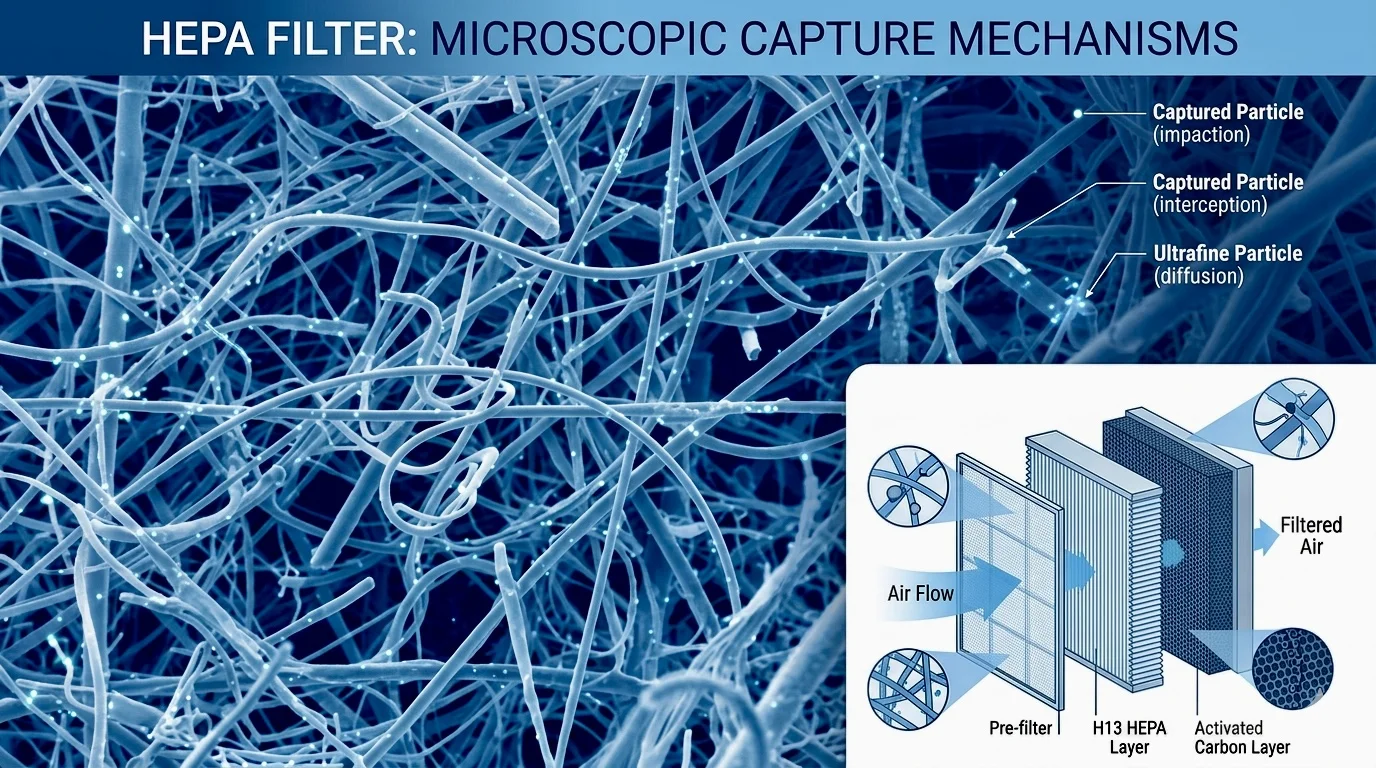
HEPA H13 vs H14 vs True HEPA: What's the Difference and Does It Matter?
HEPA H13, H14, True HEPA, HEPA-type — what's the difference? We break down HEPA filter grades, efficiency ratings, and which one you actually need for your air purifier.
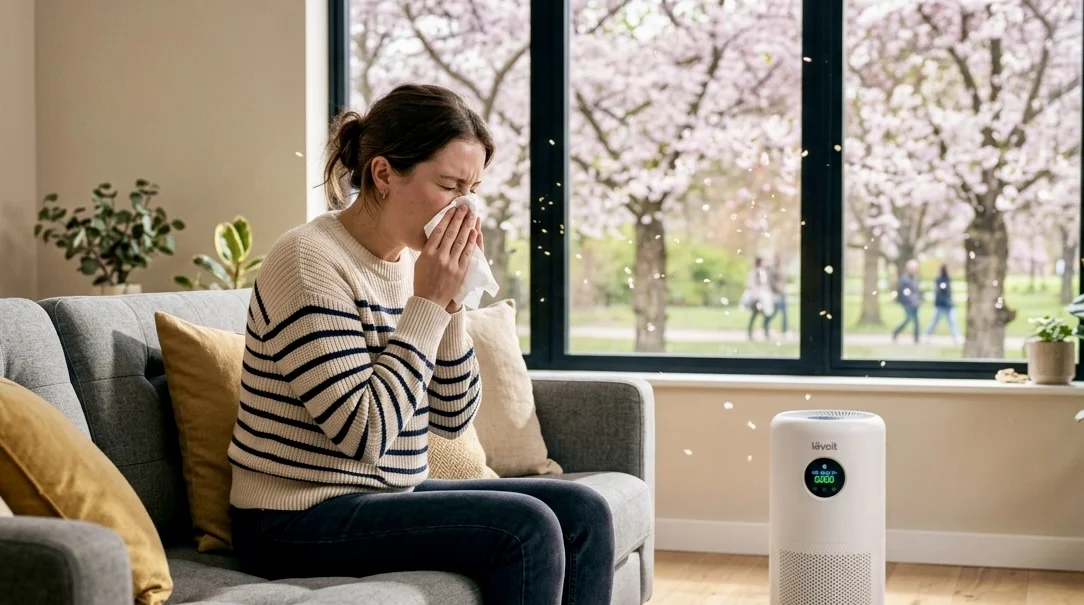
Best Air Purifiers for Spring Allergies 2026: Pollen Season Survival Guide
Spring pollen season making you miserable? We tested the best air purifiers for allergies in 2026, including Dyson, Shark, and Medify Air. Real CADR data, real relief.
🛒 Products Mentioned
As an Amazon Associate, we earn from qualifying purchases.
Covers indoor air quality science, respiratory health, allergy management, and wildfire smoke protection.
View all articles by Sarah →