The Short Answer: Indoor air is 2-5x more polluted than outdoor air. Americans spend 90% of their time indoors. HEPA air purifiers reduce PM2.5 by 50-70% and can decrease allergy symptoms by 30-50% with consistent use.
Behind every air purifier recommendation is a data point, a study, a government statistic, an industry report, that explains why cleaning indoor air matters. We’ve compiled the most important numbers that put your clean air decisions in context, organized by category with sources.
Whether you’re shopping for your first purifier or justifying the purchase to a skeptical partner, the statistics below tell the full story: how polluted our indoor air really is, what the market looks like in 2026, what the health research says, and what the data tells us about which devices actually work.
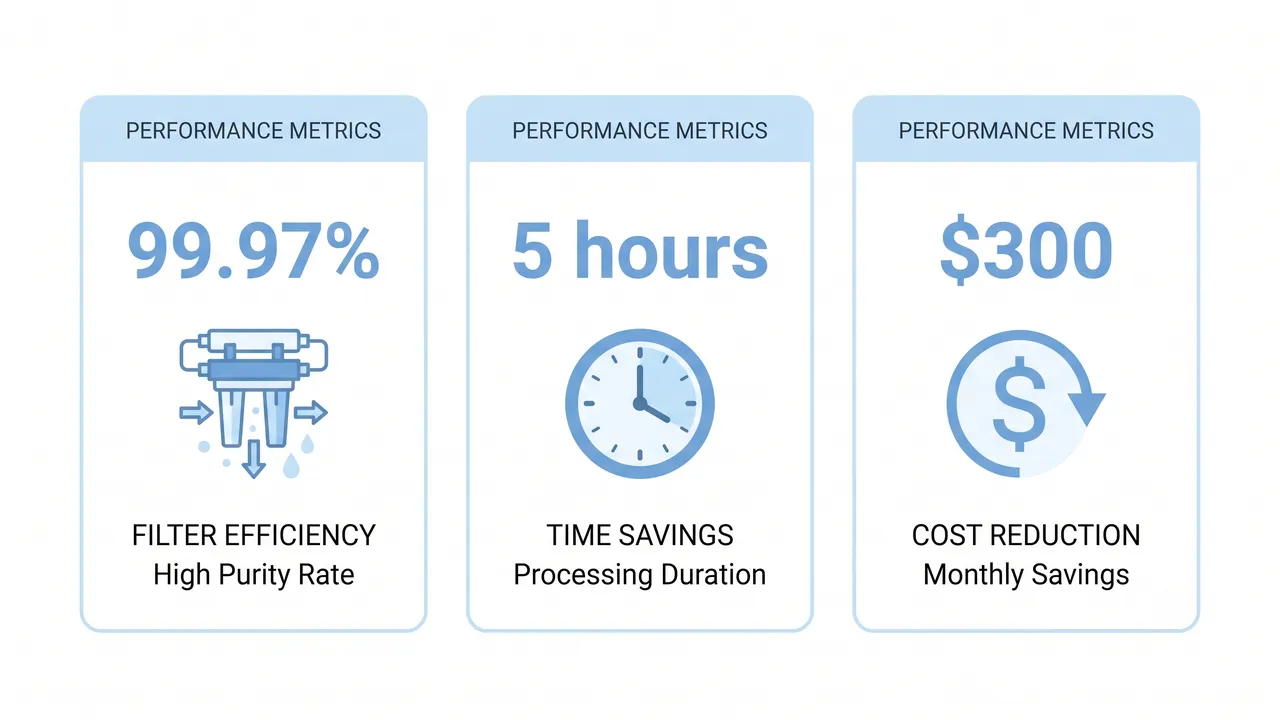
Indoor Air Quality Statistics by the Numbers
The indoor air quality problem is bigger than most people realize. Here are the numbers that define it:
- Indoor air is 2–5 times more polluted than outdoor air, according to the U.S. Environmental Protection Agency (EPA). During specific activities like painting, cooking without ventilation, or using aerosol products, indoor pollutant concentrations can spike to 100 times higher than outdoor levels.
- Americans spend approximately 90% of their time indoors (EPA National Human Activity Pattern Survey). This means the air inside your home, office, and school has far more influence on your health than the air outside.
- The average U.S. household generates approximately 40 pounds of dust per year. That dust carries a cocktail of allergens, heavy metals, flame retardants, and microplastics.
- Gas stoves are present in roughly 38% of U.S. households. A 2023 study published in the International Journal of Environmental Research and Public Health attributed 12.7% of current childhood asthma cases to gas stove emissions, the equivalent of 650,000 children in the U.S. alone.
- 1 in 15 U.S. homes has elevated radon levels (EPA). Radon is the second-leading cause of lung cancer after smoking, responsible for an estimated 21,000 deaths annually. Critically, no air purifier removes radon, only proper ventilation and mitigation systems address it.
- Volatile organic compounds (VOCs) are found at concentrations 2 to 5 times higher indoors than outdoors in both urban and rural homes (EPA). Common sources include cleaning products, air fresheners, new furniture, paint, and building materials.
- Carbon dioxide (CO₂) levels in bedrooms frequently exceed 1,000 ppm overnight when doors and windows are closed, compared to roughly 420 ppm outdoors. Levels above 1,000 ppm are associated with impaired sleep quality and next-day cognitive performance.
Indoor Air Pollutant Levels at a Glance
| Pollutant | Typical Indoor Level | Outdoor Level | Key Indoor Source |
|---|---|---|---|
| PM2.5 | 10–30 µg/m³ (up to 100+ during cooking) | 5–15 µg/m³ | Cooking, candles, smoking |
| VOCs (formaldehyde) | 20–50 µg/m³ (new homes: 100+) | 1–10 µg/m³ | Furniture, paint, cleaners |
| CO₂ | 600–2,000 ppm | 420 ppm | Human respiration |
| NO₂ (gas stove homes) | 50–100 ppb | 10–30 ppb | Gas combustion |
| Radon | Varies (1–10+ pCi/L) | ~0.4 pCi/L | Soil beneath home |
Sources: EPA, WHO, Lawrence Berkeley National Laboratory, various peer-reviewed studies.
Air Purifier Market Data 2026
The air purifier industry has experienced dramatic growth driven by pandemic awareness, wildfire smoke events, and rising allergy rates. Here’s what the market looks like right now:
- The global air purifier market reached approximately $13.6 billion in 2025, projected to grow at an 8.1% compound annual growth rate (CAGR) through 2030, reaching an estimated $20.1 billion (Grand View Research).
- The North American market accounts for roughly 30% of global revenue, with the U.S. being the single largest national market.
- HEPA-based purifiers dominate, holding over 45% of the market share by technology type. Activated carbon filters represent the second-largest segment.
- The residential segment is the largest end-use category, accounting for more than 60% of revenue, followed by commercial and industrial applications.
- The best-selling air purifier on Amazon is consistently the Levoit Core 300, a compact HEPA unit priced around $99. The Coway AP-1512HH and Winix 5500-2 are the top recommendations across Wirecutter, Consumer Reports, and other review outlets.
- Replacement filter sales represent a recurring revenue stream estimated at 20–25% of total market value, a reminder that the purchase price is only part of the total cost of ownership.
Market Growth Trajectory
| Year | Estimated Global Market Size | Growth Driver |
|---|---|---|
| 2020 | $10.1B | COVID-19 pandemic demand |
| 2022 | $11.8B | Wildfire awareness, supply recovery |
| 2024 | $12.9B | Continued allergy/asthma growth |
| 2025 | $13.6B | Regulatory awareness, smart features |
| 2030 (proj.) | $20.1B | 8.1% CAGR, emerging market adoption |
Source: Grand View Research, Allied Market Research, Mordor Intelligence.
Key trends shaping the 2026 market include smart-home integration (Wi-Fi-enabled purifiers with app control), sensor-driven auto-mode operation, growing demand for units with activated carbon for VOC removal, and increasing adoption in the Asia-Pacific region driven by urbanization and outdoor air pollution.
Health Impact Statistics
The health consequences of poor indoor air quality are well-documented by major health organizations. These numbers explain why air purifiers exist and who benefits most.
Respiratory Disease Burden in the U.S.
| Condition | Affected Americans | Primary Source |
|---|---|---|
| Allergies | ~50 million | Asthma and Allergy Foundation of America (AAFA) |
| Asthma | ~25 million (including 5.5 million children) | CDC |
| COPD | ~16 million (diagnosed) | CDC |
| Lung cancer | ~236,000 new cases/year | American Cancer Society |
- PM2.5 exposure causes an estimated 4.2 million premature deaths globally per year (World Health Organization, 2021). In the U.S., the figure is approximately 100,000–200,000 deaths annually attributable to long-term fine particle exposure.
- The WHO Global Air Quality Guidelines (2021) recommend annual mean PM2.5 levels below 5 µg/m³, a threshold that most U.S. cities fail to meet during wildfire smoke events. The current U.S. EPA standard is 9 µg/m³ (revised from 12 µg/m³ in 2024).
- A landmark 2017 study in JAMA Internal Medicine found that long-term PM2.5 exposure accelerated lung function decline in adults over age 65, even at levels below the then-current EPA standard.
- HEPA filtration in the homes of COPD patients was associated with an 18% reduction in exacerbation frequency (2020 meta-analysis published in Environmental Research). This is one of the strongest direct-impact data points for air purifier use in clinical populations.
- CO₂ levels above 1,000 ppm, extremely common in meeting rooms, classrooms, and densely occupied spaces, reduced cognitive function test scores by 15–50% depending on the cognitive domain tested (Harvard T.H. Chan School of Public Health, COGfx Study, 2015).
- Wildfire smoke exposure is now a major public health concern. The wildfire season in the western U.S. is approximately 78 days longer than in 1970. During the June 2023 Canadian wildfire smoke event, New York City’s Air Quality Index (AQI) reached 484, classified as “Hazardous” and more than 8 times the threshold for “Unhealthy.”
Who Benefits Most from Air Purifiers?
Based on the health data, these populations see the greatest measurable benefit:
- Allergy and asthma sufferers, Reduced airborne allergens (dust mites, pollen, pet dander) directly decrease symptom frequency.
- COPD and chronic respiratory disease patients, Lower PM2.5 reduces exacerbation risk.
- Infants and young children, Developing lungs are more vulnerable to pollutant damage; gas stove households in particular benefit.
- Elderly adults (65+), Accelerated lung function decline from PM2.5 is well-documented in this age group.
- Anyone in wildfire-prone regions, Seasonal smoke events create dangerous indoor PM2.5 spikes even with windows closed.
Related: Best Air Purifiers for Allergies and Asthma · Kitchen Air Quality and Gas Stove Guide · Wildfire Smoke Air Purifier Guide
Air Purifier Effectiveness: What the Research Says
Not all air purifier claims are equal. Here’s what peer-reviewed research and government-funded studies actually demonstrate:
PM2.5 Reduction
- A HEPA air purifier reduces bedroom PM2.5 concentrations by 45–65% on average, according to a 2020 study published in Indoor Air. Results vary based on room size, air changes per hour (ACH), purifier CADR rating, and baseline pollutant levels.
- Continuous operation significantly outperforms intermittent use. Running a purifier intermittently (e.g., only at night) results in 40% higher average 24-hour PM2.5 exposure compared to continuous operation (Indoor Air). For the best results, leave your purifier running 24/7.
Pathogen and Allergen Removal
- HEPA filtration in classrooms reduced COVID-19 incidence by 48% in a CDC-funded study conducted in Georgia elementary schools (2021). This study provided strong real-world evidence for HEPA effectiveness against airborne pathogens.
- True HEPA filters capture 99.97% of particles at 0.3 microns. Importantly, HEPA filters are actually more efficient at capturing particles smaller than 0.3 microns, including viruses, due to diffusion capture mechanisms. This is counterintuitive but well-established in filtration physics. The 0.3-micron threshold (the “most penetrating particle size”) represents the worst-case capture efficiency, not the best.
- HEPA purifiers significantly reduce airborne allergen concentrations, including dust mite allergens, pet dander, and mold spores, though they do not remove allergens settled on surfaces.
VOC and Gas Removal
- HEPA filters alone do not remove gases, VOCs, or odors. For these pollutants, you need activated carbon filtration. The amount of carbon matters, a thin carbon mesh (common in budget purifiers) provides minimal VOC removal. Units with 2+ pounds of activated carbon granules offer substantially better performance.
- Some purifiers use photocatalytic oxidation (PCO) or plasma technology to break down VOCs, but independent research on these technologies is mixed, and some produce harmful byproducts like ozone. Stick with proven activated carbon unless you’ve done specific research.
What Air Purifiers Cannot Do
- Remove radon gas, requires dedicated ventilation/mitigation systems
- Eliminate settled dust and allergens, regular vacuuming and cleaning remain essential
- Replace ventilation, fresh outdoor air exchange is still important for CO₂ and humidity control
- Work in oversized rooms, a purifier rated for 200 sq ft will not effectively clean a 500 sq ft space
See also: HEPA Filter Deep Dive Guide · Air Purifier Technology Comparison · How to Choose an Air Purifier: CADR and ACH Guide
The Stat That Should Change How You Think About Indoor Air
The EPA’s “2–5 times more polluted indoors than outdoors” statistic is widely cited but misleading without context. In a well-maintained home with no indoor combustion sources, good ventilation, and regular cleaning, indoor air can be cleaner than outdoor air. In a home with gas cooking, scented products, pets, and infrequent vacuuming, indoor air can be 10+ times worse.
The actionable takeaway: indoor air quality is a function of what you bring into the home and what you fail to remove. An air purifier addresses the “fail to remove” part. Reducing scented candles, aerosol cleaners, and cooking emissions addresses the “bring into the home” part. Both matter. The purifier is not an excuse to ignore source control.
Frequently Asked Questions (FAQ)
How much does running an air purifier cost per year?
A properly sized mid-range HEPA air purifier on auto mode costs approximately $7–20 per year in electricity in the U.S. The bigger ongoing cost is replacement filters, which typically run $30–80 per year depending on the brand. Budget roughly $50–100 total per year for operation. See our Air Purifier Replacement Filter Guide for ways to save.
Can an air purifier remove viruses from the air?
Yes, True HEPA filters capture 99.97% of particles at 0.3 microns and are even more efficient at smaller sizes (including virus-sized particles of 0.1 microns) due to diffusion. The CDC-funded Georgia classroom study found a 48% reduction in COVID-19 incidence with HEPA purifier use. However, air purifiers are one layer of protection alongside vaccination, ventilation, and hygiene, not a standalone solution.
How long does it take for an air purifier to clean a room?
A properly sized purifier (matched to room square footage at the correct CADR) will reduce particle counts by roughly 80–90% within 30–60 minutes on high speed. The standard recommendation is to achieve at least 4–5 air changes per hour (ACH) for meaningful pollutant reduction. Use our CADR Calculator to verify your unit is sized correctly.
Do air purifiers help with allergies and asthma?
Yes. 50 million Americans suffer from allergies and 25 million have asthma (AAFA, CDC). Research consistently shows HEPA air purifiers reduce airborne allergen concentrations. A 2020 meta-analysis found HEPA filtration reduced COPD exacerbations by 18%. For allergy and asthma sufferers, a HEPA purifier in the bedroom is one of the most cost-effective interventions available. See our Best Air Purifiers for Allergies Guide.
Should I run my air purifier all day or just at night?
Run it continuously, 24/7. Research published in Indoor Air found that intermittent operation results in 40% higher average PM2.5 exposure compared to continuous operation. Modern purifiers with auto mode and air quality sensors will ramp down to a quiet, energy-efficient speed when air is clean, so there’s minimal downside to leaving them on. See our detailed guide: How Long Should You Run an Air Purifier?
Statistics Sources and Methodology
The statistics cited throughout this article come from the following types of sources. We prioritize government agencies, peer-reviewed research, and established market research firms:
| Source Type | Examples | Cited In This Article |
|---|---|---|
| Government Agencies | U.S. EPA, CDC, WHO | Indoor air quality, health statistics, radon data |
| Peer-Reviewed Journals | Indoor Air, JAMA Internal Medicine, Environmental Research | Purifier effectiveness, health impact studies |
| Research Institutions | Harvard T.H. Chan School of Public Health, Lawrence Berkeley National Laboratory | CO₂ cognitive effects, gas stove emissions, range hood usage |
| Market Research Firms | Grand View Research, Allied Market Research, Mordor Intelligence | Market size, growth projections, segmentation data |
| Nonprofit Organizations | AAFA, American Cancer Society | Disease prevalence, allergy/asthma statistics |
A note on accuracy: Statistics in the indoor air quality and air purifier space can vary significantly depending on the study methodology, geographic location, housing stock, and measurement conditions. When ranges are given (e.g., “2–5 times more polluted”), they reflect the range reported across multiple studies or the range of conditions observed, not a single measurement. Market projections are estimates and subject to revision. We link to source studies where possible so you can evaluate the data yourself.
Last updated: June 2026.
See also: How to Read Air Quality Index (AQI) · Air Purifier Myths and Mistakes Debunked · Best Air Purifiers 2026 Complete Guide · DIY Ways to Improve Indoor Air Quality · Air Purifier for Pets, Dander, and Odor
Disclosure: As an Amazon Associate, The Air Purifier Guide earns from qualifying purchases. This comes at no extra cost to you and helps us maintain this site. We only recommend products we’ve genuinely researched and believe in. Learn more about our affiliate policy.
You May Also Like
- Air Purifier Placement Guide: Where to Put It for Maximum Effectiveness
- Air Purifier vs Opening Windows: Which Is Better for Indoor Air Quality?
- How Long Should You Run an Air Purifier? 24/7, Only When Home, or Somewhere in Between?
- How to Tell If Your Air Purifier Is Actually Working: 5 Simple Tests
Related Articles
Air Purifier for COVID: What the Research Actually Says
Do HEPA air purifiers really protect against COVID? We review EPA guidance, 2025 research studies, and what actually works for virus protection.
Air Purifier WiFi: Is It Worth Paying Extra for Smart Features?
Is WiFi on an air purifier worth $50-100 more? We compare smart vs non-smart models from Levoit, Coway, Winix, and Dyson to help you decide.
New Nursery Furniture Smells? What You Need to Know About VOCs
New nursery furniture off-gasses VOCs and formaldehyde. What the research says about protecting your baby, and what actually helps.
Best Air Purifier for Weed Smoke From Neighbors (2026)
Neighbor's weed smoke seeping into your apartment? We tested air purifiers with heavy carbon filters to find which ones actually eliminate marijuana odor and particles.
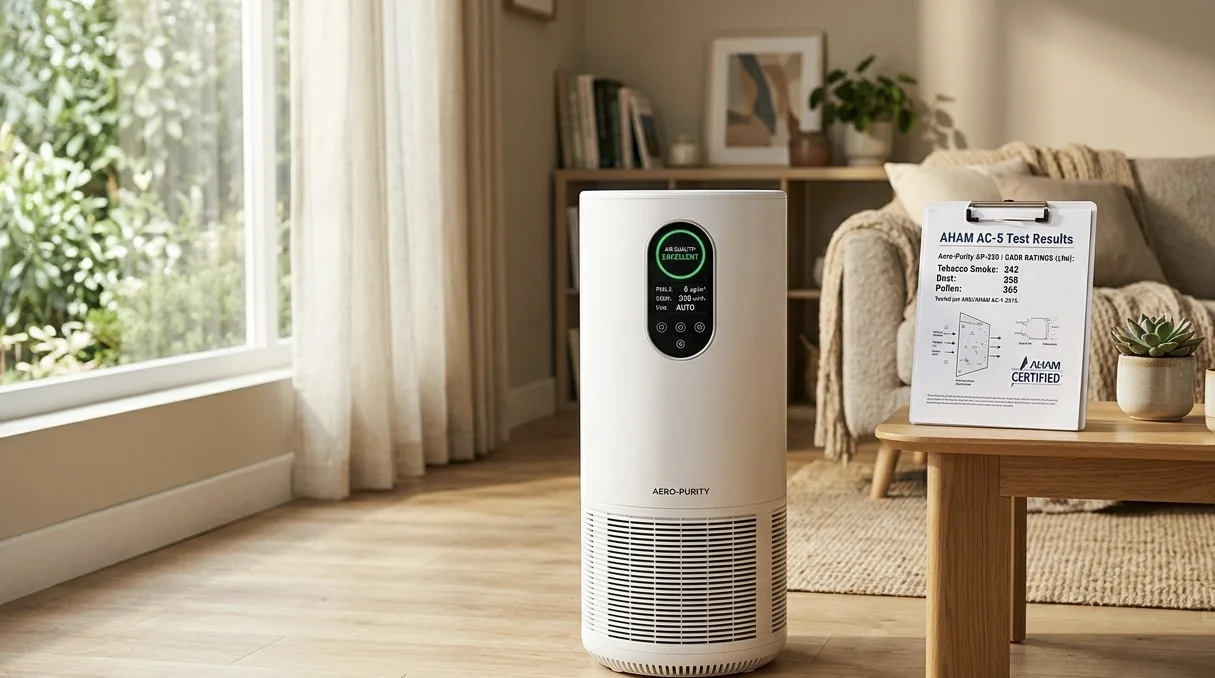
AHAM AC-5 Air Purifier Test: What It Means and Why It Matters
What is the AHAM AC-5 test for air purifiers? We explain how AHAM Verifide testing works, what CADR ratings mean, and why it matters when choosing an air purifier.
🛒 Products Mentioned
As an Amazon Associate, we earn from qualifying purchases.
Runs side-by-side purifier comparisons, long-term ownership reports, and filter cost analysis.
View all articles by David →